3 must have PPC reports
There is an endless supply of data coming from Adwords; sometimes getting through all the data can be a little daunting. It can be easy to get lost in all of it and not really know what you should be focusing on. What you should be focusing on is:
- What is and isn’t working?
- Where is your money being wasted?
- Where can you step on the gas?
Here are a few simple reports that you can run in Adwords that can help you weed through all the data and make some quick decisions.
Adwords Report #1: Top Vs Other.
Where to find it
You can find it on the campaign, ad groups, keywords and ads tabs in the “segment” drop down.
![]()
What it shows
The report will show you what your performance looks like at either the “Top” positions (usually positions 1 through 3) or the “Other” positions (usually to the left of or below the search results).

How It Helps You
Sometimes the top position isn’t the best position to be in – it can be expensive and, if you have a tight budget, could be actually restricting the number of conversions you could get. This quick report shows you what positions work best for you. By checking out the CPA and conversion rate for the positions, you can figure out where you want to show on the page. In the above case though the top rankings are performing the best, with significantly higher CTR’s.
Adwords Report #2: Geographic Dimension.
Where to find it
This report can be found on the campaign, ad groups, keywords and ads tabs in the “Dimensions” drop down.

What it shows
The report shows a list of the physical locations (locations where a user is physically located) and the location of interest (location that someone was searching for or that was related to the content that she was viewing)
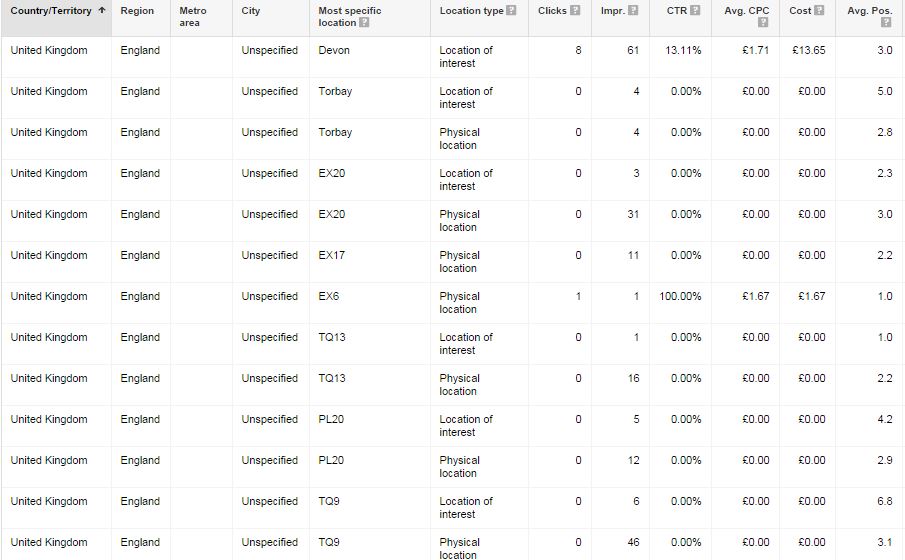
How it helps you
Getting an idea of where your traffic is coming from is a great way to target ads to these locations more. perhaps you have some local knowledge of the demographic area, and are prepared to up the spend for that location, particularly if your ads are looking to get a lot of clicks from these areas. Or you may find that you want to create a specific ad for this location, perhaps focusing on messages about quality rather than price.
Adwords Report #3: Time Dimension.
Where to find it
This report is also found under the Dimensions tab for campaign, ad group, keywords and ad tabs levels.

What it shows
The ‘time’ shows dropouts for day of the week, day, week month, quarter, year, hour of the day

How it helps you
This report comes into its own when you monitor it over a period of time. In this way you can begin to see trends. so if you know your ads are mostly seen on Monday and Tuesday evenings between 7pm and 9pm, then you can allocate more funds for these day to make sure your ad is most visible for these times. Also, its a great tool to monitor any offline advertising you may have running such as radio ads. You can see any spikes based on when your ads ran, the data for which you should have at hand.
These reports can help defend or justify any gut feelings you may have to one course of action or another for your PPC. its advised to use in conjunction with other information and metrics. To find our more about PPC and on-line advertising call Dental Design on 01202 677277.
More posts from our team
Five Star
Reviewed Marketing


 "Would definitely recommend to a friend"
"I cannot recommend Dental Design highly enough"
"Really great company to deal with"
"Very professional, efficient & adaptive to new situations"
"I cannot recommend them highly enough"
"Has been invaluable and gone out of her way to help us"
"We love the look of our practice website. Very professional!"
"Dental Design stood out both in their knowledge of the industry and their professionalism"
"The team and package offered at dental design was unrivalled"
"absolutely fantastic and are always on hand to help"
"Dental Design are fantastic to work with"
"always met with a swift and professional response"
"Would definitely recommend to a friend"
"I cannot recommend Dental Design highly enough"
"Really great company to deal with"
"Very professional, efficient & adaptive to new situations"
"I cannot recommend them highly enough"
"Has been invaluable and gone out of her way to help us"
"We love the look of our practice website. Very professional!"
"Dental Design stood out both in their knowledge of the industry and their professionalism"
"The team and package offered at dental design was unrivalled"
"absolutely fantastic and are always on hand to help"
"Dental Design are fantastic to work with"
"always met with a swift and professional response"
